Topik Utama

Showing posts with label research. Show all posts

Wednesday, June 6, 2012

Drying vs tempreature

After getting a bunch of new samples, I decided to delve in the drying methods of the chiku. Previously, I've tried air drying out in the open and cabinet drying, both in room temperature. But there are a few setbacks in this method, such as the long time that increases the susceptibility to airborne fungi contamination. Thus, as I found out in the previous post, there are many temperatures and settings that can be used to dry the cut fruit. Therefore I studied different temperatures that is most effective to dry a sample, as in the research of Chien et al, 2009.

Three samples of similar maturity (around 1kg per temperature) is peeled, sliced and oven-dried into constant weight. Three temperatures are used--50, 60, and 70. The time of drying, yield, and properties is as follows.

According to the Chien study, higher temperatures can give better antioxidant activity. This is the exact opposite of some other fruit drying results such as Larrauri et al, (1997), Garau et al (2007), and Shiau, Wu and Chang (2012); but similar to results of Madrau et al, (2008), where its antioxidant components slightly increase. Although in this study, it claims that 60C does not change much of the fruits' properties.

Therefore, I shall use the middle tempreature of 60C for drying. Although I need to make sure there are less gummy samples after drying.

Tuesday, May 29, 2012

Extraction Types

During the course of the fruit extraction, I've been experimenting with two extraction types lately, one being water extraction and the other being ethanol 95%. When tested with the same five microbes, these are the results:

1) Water extraction

2) Ethanol extraction

From these tests I can conclude that both extract had somewhat of an inhibition activity towards microbes tested. A clear ring is seen around the disks for both extract types (except conc 25% and below). However, water extraction is not very effective in showing anti m/o activity. There is a huge difference in the two activities, even of similar fruits with similar maturity. According to the S/V, since ciku is full of polyphenols and other antioxidants (non-polar solvent soluble), those activities may be more observable in non-polar solvent.

One other reason that proved this is the fact that Ciku has very high antioxidant capacity. L-ascorbic acid equivalent antioxidant capacity, AEAC, is the highest compared to other local fruits such as starfruit, guava, salak, pineapple and so on.


from Leong and Shui, 2001

In this experiment above, the ciku used is unripe. Fruit is peeled and blended, and mixed into 50% ethanol at 1:10 w/v, and centrifuged to obtain supernatant. This is different than the method I encountered which used ripe fruits (H. N. Sin et al, 2006) . However, after many unsuccessful attempts with ethanol extract (very little antimicrobial activity), I may conclude that ethanol may not be fully optimized for these kind of fruits. I may need other types of extracting solvent. A few suggestions are hexane, acetone and methanol.

One research delved on the various types of extraction, and chose acetone as the preferred solvent (Shui, Wong, and Leong, 2004). Acetone 50% is used directly to extract pulp of ciku for 45 minutes at 90C. Then it is rapidly cooled to room temperature before centrifugation at 14000g. This extract is used for spectrophotometry testing of TPC. Another research (Chong et al, 2005) also uses acetone (70%), but after it the ciku was homogenized it in ultrasonic bath for 30 minutes before centrifuging it for 15 min at 5000rpm. This is different than Ma et al, (2003), who uses methanol for ciku extraction and later fractionate it using hexane and ehtyl acetate.

Another possible error (while doing ethanol extraction) is the drying part. Previously I used "room temperature drying", i.e. 26-28C, to dry the ciku before extraction as specified by Jayakumar and Kanthimathi (2011). However, it is recently found out by Chong et al (2009), that the higher the drying temperature the higher the phenolics in the ciku.
In this experiment, ciku slices is dried until constant weight, between 15 minutes to 7 hours. Therefore, higher temperature can be used to dry the ciku; with only the time period is of concern.

Thursday, April 19, 2012

2. Antimicrobial activity, minimum inhibitory conc.


The continuation of the research has focused on the two most significantly inhibited microbes, the E.coli (EC) and the L.monocytogenes (LM). For the other three, last week’s experiment is repeated on them, using fresh culture.

2.1 For EC and LM, three concentrations are prepared; 100%, 50% and 25%. The original sample is diluted until the desired concentration. 


Result is as follows:
a) LM
Conc.
50
25
1
12
15
2
12
0
3
13
0
AVERAGE
12.3
15

b) EC
Conc.
50
25
1
0
12.5
2
0
12
3
0
12
AVERAGE
0
12.16667


Main problem: Sample is too viscous and sticky to be removed using a pipette. Therefore solvent is poured in and shaken as much as possible to dissolve the sample. But not all is dissolved, some remain sticking to the base of the container.

Therefore it is difficult to gauge the real inhibitory activity for 25% and 50% since there might actually be lower concentration of ciku compound in diluted sample.

2.2 For Retest of antimicrobial susceptibility (SA, STY and I), result is as follows:

Take note that if a “ring” is observed for streptococci types, it is deemed resistant regardless of the clear zone size, because of the beta-lactamase produced by the m/o.

Suggestion:
to do it in a spread plate method, using cotton swabs, to make sure the m/o spreads properly.
Also, look into other journals, to see what kind of extract is used--eg. methanol and hexane, since the viscosity may be attributed to the solvent.

Sunday, April 15, 2012

Antimicrobial test: Result!

In continuation with last week's experiment result (which proved that my current extract is contaminated), another extract is used to repeat the experiment. This time I used an older extract, which is much more dark, concentrated and viscous (therefore cannot be poured using a pipette).
The method is still the same, that is:

Prepare a 24 hour culture suspension of the selected microbes: S. aureus, E. Coli, L. monocytogenes,  S. typhi, and S. I.

An agar-well test is made using the selected microbes. Three holes of .7mm are plugged out on each plate and poured with samples. (Samples are used at 100% conc to see their effectiveness first) The plates are incubated 18hr in 37C.

Results are in as follows:

ST-no zone

SA-no zone
LM- clear zone

EC-clear zone

I-not much growth, but not very clear zone
 Therefore, after much measurement, we have:
Average inhibition zone, in mm
Looking at I plate sets, the zone are not that clear, but the microbe growth is not that vigorous either. There are spots of microbe in the "zone" around the plates. This either due to 1) microbes in I are slow-growing (not so) or 2) it's very effective that no microbe has grown. The little growth seen are probably lucky few contaminant/resistant ones.

In conclusion, the sample is very effective on L.monocytogenes, E.coli, and not effective on S.aureus and S.typhi. More test should be done to confirm I.


Tuesday, April 10, 2012

What went wrong?

A good trait of a scientifically-trained person is to investigate a result that goes differently than expected. Now, what is to do, for example, if the result seems neither bad nor good?


The case in hand--this is an antimicrobial test using the Agar-Well method. 24-hour cultured microbes are grown in plates using pour agar method. 100 microliter of sample extract is poured into wells of 0.7mm diameter. Then, it is incubated for 18 hours. The expected result is an inhibition zone, that is a clear zone with no microbe growth around the well of the sample.

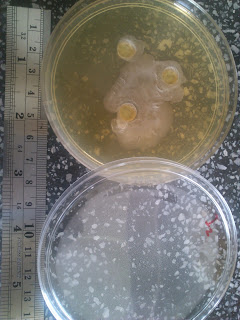
The result that came out isn't as expected--an inhibition zone is shown all right; but it is not a clear zone. Rather, it seems very opaque. As follows.


So, after much pondering, possible explanation is as follows:
1) the sample really spread outside the well, creating an inhibition zone.
2) that wasn't the sample, it was a living, growing microbe.

therefore, this hypothesis is put to the test by taking a bit from the "inhibition zone" and streaking it on a new plate:
A growth of similar shape and color occurs, which tells me this is a microbe. So the (2) reason is accepted.

Then, looking deeper, the second reason has two possible outcomes, that is:
a) the sample is contaminated from somewhere else.
b) the sample has it's own microbe that has inhibitory properties.

So, to test this, is to take a swab of the original sample straight from the bottles, for every batch.
The swab is streaked on a nutrient agar and left for 18 hours. If not all the sample shows the growth, (a) is true. But if every batch shows the same microbe, (b) is true.

The result is shown as below:


Well, only one sample plate shown to have the microbe--the 6th March sample used in the agar-well test. Therefore, it is proven that this is a one-off contamination and not a special microbe.


Another thing to add--during the agar well test though, in some other plates, the growth inhibition effect does not show. it can be explained, since probably the microbe in the sample is unable to inhibit the culture's microbes.


So in conclusion, one of the sample was contaminated with a microbe that is selectively inhibiting. May be useful, maybe not. We'll see.

I guess that is how a student's mind should work eh. Later guys :)

Thursday, March 15, 2012

Ciku antimicrobial activity report

After I did some extraction last week, I gave a bottle of the frozen extract to another researcher for an antimicrobial activity pre-test. My objective is to see whether how much, and at what concentration, is the activity in Ciku extract.

The researcher, Cindy, proposed a pretest using the method she is familiar with, which is outlined below:
  1. Saline and media is prepared, around 30 plates. Media: Mueller-Hinton.
  2. Microorganism is isolated, around 100 microliter into a saline and adjusted with McFarland standard.
  3. 100 microliter of the mircoorganism is streaked on plates of Mueller-Hinton agar.
  4. A dilution of the extract is done at 0%, 50%, and 25% dilution level.
  5. 1000 microliter of each diluted extract is pipetted into three 6.00mm filter paper disks.
  6.  Disks are placed on the media carefully with forceps.
  7. The plates are incubated for 16-18 hours in 37C.
  8. Clear zones is measured, if any, and recorded in mm.
 And, the results are given as below:

So as you can see here, the ciku is compared with a control antibiotic. The inhibition zone is under 20 mm for ciku extract while the antibiotic is above 40mm. According to standard, this can be translated to antimicrobial activity as follows:
Not effective
10 or less
intermediate
11 to 15
effective
16 or more


Therefore, the ciku is between intermediate and not effective. But mostly, not effective.
How is this so, especially when ciku has been proven to have anticancer activity as shown in breast cancer cells (Jayakumar and Kanthimathi, 2011) and colon cancer cells (Ma et al, 2003)? In these studies as well, it is explained that the activity is attributed to its polyphenols and flavonoids, which is proven to have an antimicrobial activity (Daglia, M., 2011

Therefore, what happens here may be attributed to an error for example, due to difference in method or experiment excecution. For example, extraction is done following exactly the one outlied in the 2011 research. However, the fruit maturity level chosen may be different since it is not stated in the research. Also, the length of exposure to light and air may destroy the polyphenols.
Another thing is that the method of antimicrobial activity may not be suitable for the type of extract. In a research on ginger as shown here (Sebiomo et al, 2010) , water extract are done using disk diffusion while ethanol extract is done using agar well. Therefore using disk diffusion, ethanol extracts of ciku may not have diffused fully onto the agar.

A suggestion is to do the experiment again with another sample extraction, to see whether this is just experimental error; or to do a newer extraction with less mature fruits.


Table from:
Johnson, T. and C. Case, 1995. "Chemical Methods of Control," adapted from Laboratory Experiments in Microbiology, Brief Edition, 4th ed. Redwood City, CA: Benjamin/Cummings Publishing Co., available online from The National Health Museum, Access Excellence Activities Exchange http://www.accessexcellence.org/AE/AEC/CC/chance_activity.html.

Wednesday, March 14, 2012

How to dispose of these bacteria?

A while back someone asked me this question: what happens after you have used a bunch of microbes? How do you dispose them? Ah, usually when we are undergrads all of these are handled by the lab staff—they instruct you to put in a blue trash bag labelled “biohazard” after each lab session. Sometimes they even let you leave them on the bench with all the utensils, where they will pick up and clean themselves.
Not as tiny as this one.
However when we are in postgrad—or using professors’ lab—it’s every man/woman for himself. Disposal of microbes are the own researcher’s responsibility. So as we were discussing, several solutions come up.

“Boil them, sterilize them!”

“What if they are spore-able microbes?”

“Then...boil them in a very long time?”

“Do they die?”

I don’t have the answers to these questions. So we left the lab with an issue still hanging (and a rack full of microbes on the bench, in case we mull over it that night and get an eureka). But then, after a bit of googling, I found a website offering a solution

An ideal situation is to put them into a heat-stable biohazard bag and autoclave it (oh so that’s what the blue bag is used for!). After autoclaving it is suitable for disposal by trash.

Another alternative method is to use bleach—yes, your good-old friendly neighborhood normal household bleach Clorox.  Make a one part bleach four parts water solution (20% Clorox) and saturate the plates with it. Leave it overnight to soak, before disposal.
Kills 99.9% of bacteria, it's super effective!
There—as simple as that. Remember that bleach is corrosive and proper hand/face/body protection should be worn. Equipment should also be rinsed thoroughly afterwards.

Sunday, February 26, 2012

Mueller-hinton Broth: Howto

Mueller Hinton broth is used as the liquid medium for reviving the microorganism for antibiotics sensitivity testing, for determination dilution studies. It is also developed for the cultivation of nesserias and other fastidious microorganism due to the richness of the medium.

Formula (g/Liter):


Equipment:
Conical flask
Heater/stirrer
Glass rod
Autoclave

Preparation:
  1. Dissolve the ingredient mix in one liter of distilled water while stirring constantly.
  2. Heat them with frequent agitation and boil for one minute
  3. Autoclave at 121C (15 lbs.sp for 15 minutes), DO NOT OVERHEAT.
  4. Cool down, and measure the pH. It should be 7.4 at 25C.

Validation test:
A good mueller-hinton broth will show growth of any of the following microbes:
  • Staphylococcus aureus ATCC25923,
  • Escherichia coli ATCC 25922,
  • Streptococcus faecalis ATCC 33186,
  • aeruginosa ATCC27835,
  • Streptococcus pyogenes ATCC 19615,
  • Listeria monocytogenes ATCC19113.

Sunday, February 19, 2012

How to make (your own) Mueller Hinton Agar

(taken from CultureMedia Manual book)

Mueller Hinton Agar is recommended for antibiotics sensitivity test and the primary isolation of gonococci and menigococci. Also it is popularly used as a plate to cultivate Nesseria sp. Making own cultures as compared to store-bought mixes, has many advanteges, which reliability being its major advantages as commercial products might not be as standardized.


Formula, in g per L:

Steps: 

  1. Add all of the above in 1L of distilled water and mix well. (pH 7.4±0.2 at 25°C)
  2. Heat, while agitating frequently and let boil for about 1 minute.
  3. Dispense and sterilize in autoclave at 121°C, 12-15psi for 15 mins.
  4. Cool to 40-50°C and add defibrinated blood if desired.
  5. If the media is used for Nesseria growth, the blood mixture should be heated to 80°C for 10 mins until chocolated, but do not overheat.
Standardization: 

This medium complies with the NCCLS (National Commitee for Clinical Lab Standard) and prepared to contain low amount of tymidine and enough calcium and magnesium ions for growth. The performance is specified by the NCCLS by conducting sensibility tests against different antibiotics using type cultures and observed after 24 hours. The diameter in mm should be as the table below:

 Well, that's all :) I'm just writing here because I can't download them due to scribd error.

Sunday, February 12, 2012

What is the concentration of my extracted sample?

Situational problem:

I have a sample made from powdered ciku slices. The powder is dissolved in ethanol (95%), filtered and evaporated. The problem is, although I begin with a standard sample weight (300g powdered ciku), I ended up with different amount of concentrated extract for every single batch. Some is as small as a few mL. Some could fill up the bottom of a 300mL flask!

What is the concentration of my extracted sample and how do I make it standardized?

Answer:


Well, we look at it this way. Concentration is measured as mg/mL, so in each bottle there is 300000mg per mL of ethanol 95% (even though it might not look like it). So, we can determine the concentration by measuring the volume inside the bottle. If there’s 5 ml inside the bottle, it’ll become 300g/5ml = 60 000 mg/mL.

Since we have so many bottles, it’s better to standardize everything to ease later dilutions. For example, fill up every bottle until 30mL mark with the same solvent. So 300g in 30mL is 10 000 mg/mL. After this we can dilute it to 1000 mg/mL, 100 mg/mL or anything we wish.

Easy eh? Why haven’t I figured this out earlier.

Tuesday, February 7, 2012

What is the McFarland standard?


While I was talking away about FYP with my sister, she mentioned that she was trying to do antimicrobial susceptibility test, on which she used a standard McFarland to measure the inoculum turbidity. Previously I thought inoculum for antimicrobial tests are standardized by CFU count. So now, what is a McFarland Standard; and how do we make it?

Well, different species (different inoculum) exhibit different inoculum density even in similar CFUs. This might be hard to measure the inhibition zone for lighter-density species. Therefore, it must be measured in a way that the density is similar, easing the data collection later.

Source
A McFarland standard is an optical standard of 0.5 made from Barium Sulfate. An equivalent optical density standard is the latex particle suspension. In this post I will put the McFarland standard procedure.

1) Prepare a Barium Chloride solution 0f 0.048 mol/L using a 1.175% w/v from a stock solution of BaCl2.H2O. Prepare also a 0.18 mol/L Sulfuric Acid from (1% v/v) stock.

2) Mix 0.5 ml of the barium chloride into 99.5 ml the sulfuric acid, with constant stirring.

3) Verify the turbidity standard with a spectrophotometer with 1-cm light path and matched cuvette at 625nm. The absorbance should be 0.008 to 0.10.


These suspensions must be kept in screw cap tubes of similar sizes with the one used in growing/diluting bacteria. No need to store it in freezer, it can do well in a cool and dark place. Before use though, just vigorously agitate this standard with vortexer. If using latex particle, just invert it gently.

Source
A standard is past its prime if large particles appear. It needs to be checked once a month as the density may change.

Well that's all folks! Another good read about the McFarland is the one posted by her, who added nutrient broth in the mix. Different people, different method.

Wednesday, February 1, 2012

Research Report: Ciku maturity

(ps. if you ask me why I put it here, it's for reference/backup purposes)

 So, a lot of people have been asking me how do I chose my ciku for research purposes. My initial answer, as I've said in the Proposal subject, is according to the ripeness index taught to me by a fellow lab technician. The reason is that there are no "Sapota Official Maturity Index"as there are for other fruits, say Carambola (Belimbing) or Papaya. The closest one for Sapota is the East African Standard, but is still in draft and not intended for official purposes.

So another way to specify the maturity level of the fruits that I chosen is by physico-chemical standards commonly employed in fruit grading. They are:

1) Color
2) Texture
3) Brix
4) pH
5) Moisture Content

Sampling method:
Sample is taken from the fruits dealer. Took as much similarly-ripened Ciku as I can (usually around 1.5kg). The ripeness is gauged by its firmness to the touch. Then after ripened overnight (I usually buy it slightly underripe) it was taken to the lab where ten of the fruit was selected for testing. They have relatively uniform size and shape.

1) Color
Color is measured using the Chroma Meter, Minolta Brand.

Ten samples is measured twice at different places and the results are recorded in L, a and b format, where L is for lightness, a is red-green and b is bluish-yellow. The sample is placed on the measuring head while making sure it completely covers the light source. Data taken are collected and averaged.


As seen here, the average is L: 61.041, a: 8.113 and b: 31.781. When put into the RGB calculator, this color is shown:
|                                                             |
|                                                             |
|                                                             | 
which almost accurately represents the color of a ripe ciku.

2) Texture
Texture analysis can help gauge the maturity of fruit. Especially when it comes to firmness, which is directly correlated to maturity (the firmer the fruit the less mature it is).The instument is Ta-xT plus texture analyzer. Since there are no methods available to assess Ciku, The method for peach firmness (PCH1/BS) is used since peach are the most similar with ciku in size and shape. These are the parameters:

Probe: Blade set HDP/BS 5 kg load cell.

Mode: Measure force in compression
Option: Repeat until count
Count:10
Pretest speed: NA
Test speed: 5.0mm/s
Post test speed: 10mm/s
Distance: 38mm
Trigger: button
Tare: auto
Data aquisition rate: 200pps

Method:
i) parameters are loaded in the Exponent software.
ii) blade is calibrated using calibrate function.
iii) each ciku fruit is cut into wedges, of similar sizes and thickness.
iv) test is started. Ciku wedge is placed perpendicular to the blade, cut into half.
v) Ciku wedges are placed one after another, while making sure not to get fingers stuck in it.
vi) after 10 counts the experiment stops and measurement are taken.

Thus, from the result, the measurements average is 649.315g. Here we can see that the flesh is quite firm.

3) Brix
Brix is a measurement of sugar content in fruit. As the fruit goes ripe, the sugar content increases and brix also increased. The equipment used is a refractometer.
Source here

Procedure:
i) All ten sample pieces are mashed into pulp.
ii) A drop of the juice is put on the glass slide.
iii)The measurement is read by looking into the eyepiece.

The measurement for the Brix of ciku juice is 21.

4) pH
pH, similarly to Brix, increases as fruit ripens. From the 10 sample-pulp juice, the pH obtained is around 5.48. pH slowly increases the longer we leave the juice idling, thus the result may not be 100% representative of true pH value. Still, it is a good result.

5) Moisture Content
Moisture content determination is just an additional measurement parameter I added, that might be useful to relate it to Brix (as water content is correlated to Brix as well). The equipment used is the infrared moisture content analyzer FD-610.
A sample around 3-7 grams is put on the drier, and preset to 100C drying at 10 min. Four measurements are obtained, 49.1%, 10.0%, 19.5% and 29.1%. The average moisture content is 26.93%. I used the method of cabinet drying, which gives a similar average is 26.9996%.

The limitation of this method compared to conventional drier-oven method is that it does not dry completely. Although I did not exceed the 7g-limit and the fruit is in small pieces, the fruit is still moist. 

Conclusion
Even without a proper standard, we can classify a fruit's maturity using its physico-chemical properties. It can help identify what samples that are used and justify its behavior in subsequent testing.
Therefore, my ciku samples' specification is as follows:

Ciku type:Subang
Origin: Ipoh
Maturity level:-
Color: L: 61.041, a: 8.113 and b: 31.781 (|                   |)
Firmness: 649.315g
Brix: 21
pH: 5.48
Moisture content: 26.9%