Topik Utama

Thursday, April 19, 2012

2. Antimicrobial activity, minimum inhibitory conc.


The continuation of the research has focused on the two most significantly inhibited microbes, the E.coli (EC) and the L.monocytogenes (LM). For the other three, last week’s experiment is repeated on them, using fresh culture.

2.1 For EC and LM, three concentrations are prepared; 100%, 50% and 25%. The original sample is diluted until the desired concentration. 


Result is as follows:
a) LM
Conc.
50
25
1
12
15
2
12
0
3
13
0
AVERAGE
12.3
15

b) EC
Conc.
50
25
1
0
12.5
2
0
12
3
0
12
AVERAGE
0
12.16667


Main problem: Sample is too viscous and sticky to be removed using a pipette. Therefore solvent is poured in and shaken as much as possible to dissolve the sample. But not all is dissolved, some remain sticking to the base of the container.

Therefore it is difficult to gauge the real inhibitory activity for 25% and 50% since there might actually be lower concentration of ciku compound in diluted sample.

2.2 For Retest of antimicrobial susceptibility (SA, STY and I), result is as follows:

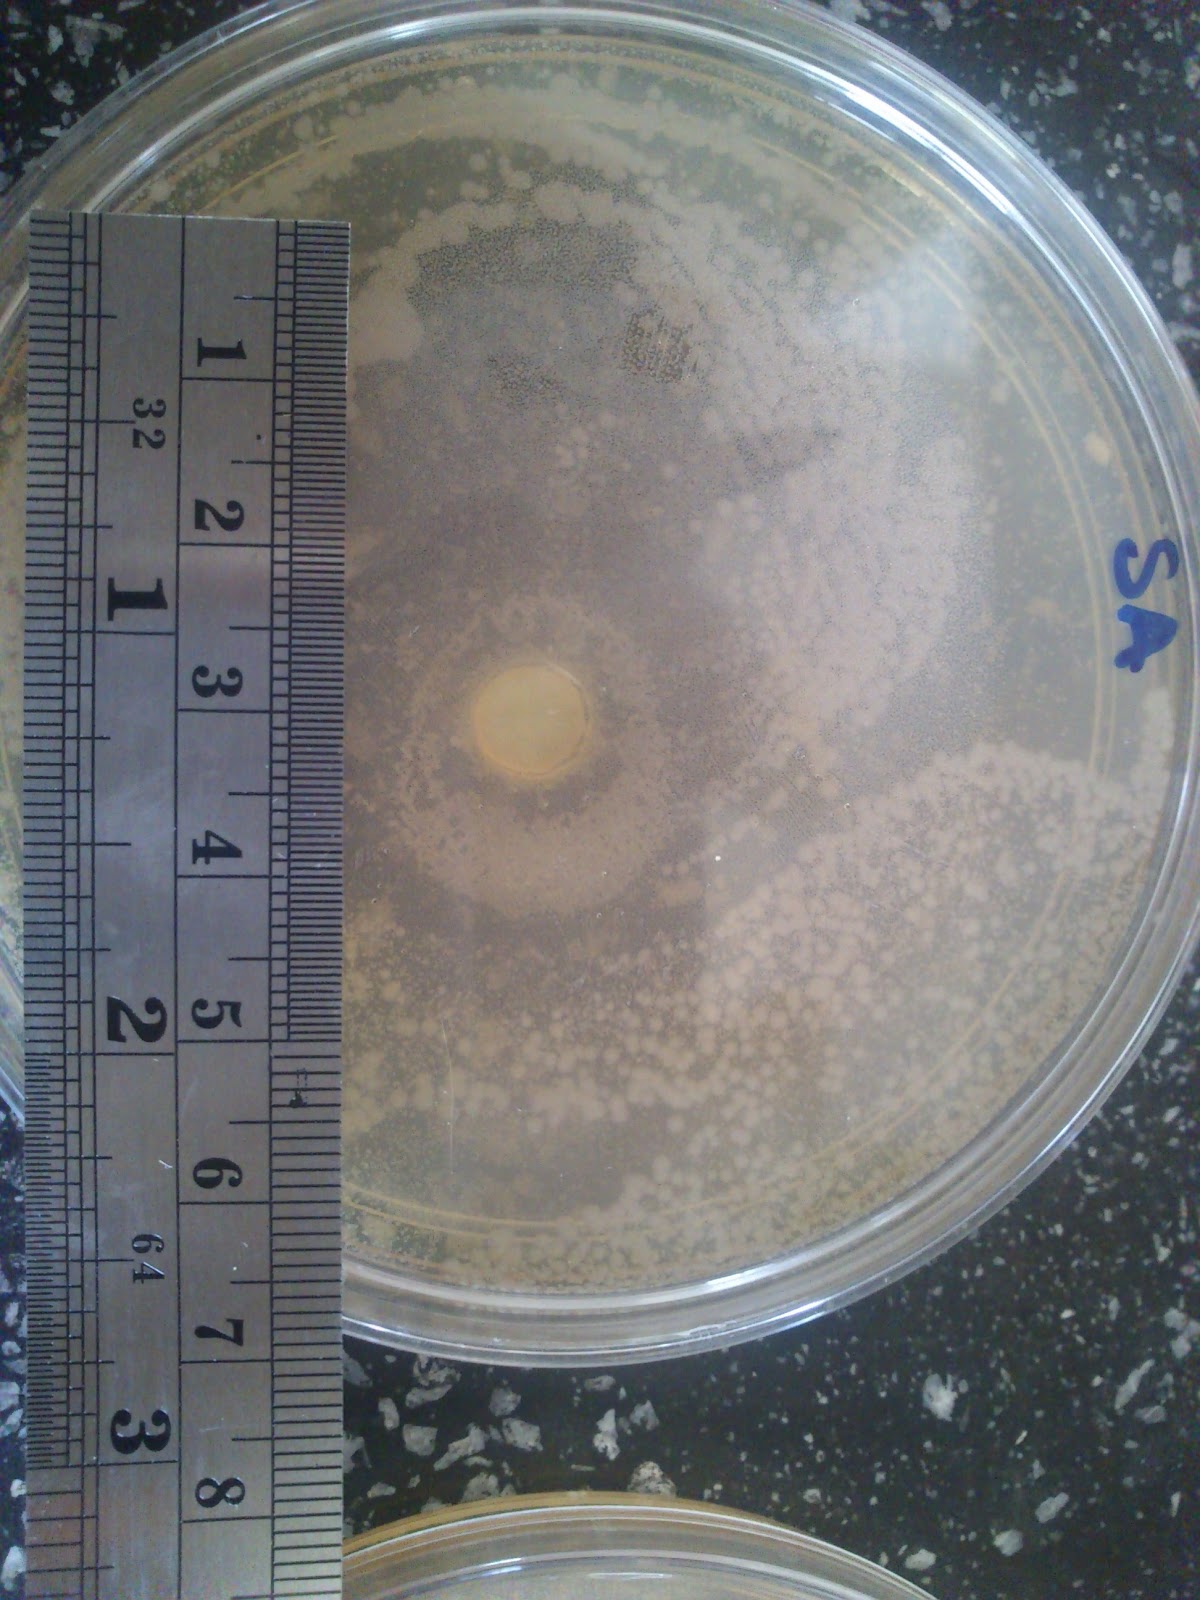
Take note that if a “ring” is observed for streptococci types, it is deemed resistant regardless of the clear zone size, because of the beta-lactamase produced by the m/o.

Suggestion:
to do it in a spread plate method, using cotton swabs, to make sure the m/o spreads properly.
Also, look into other journals, to see what kind of extract is used--eg. methanol and hexane, since the viscosity may be attributed to the solvent.

Sunday, April 15, 2012

Antimicrobial test: Result!

In continuation with last week's experiment result (which proved that my current extract is contaminated), another extract is used to repeat the experiment. This time I used an older extract, which is much more dark, concentrated and viscous (therefore cannot be poured using a pipette).
The method is still the same, that is:

Prepare a 24 hour culture suspension of the selected microbes: S. aureus, E. Coli, L. monocytogenes,  S. typhi, and S. I.

An agar-well test is made using the selected microbes. Three holes of .7mm are plugged out on each plate and poured with samples. (Samples are used at 100% conc to see their effectiveness first) The plates are incubated 18hr in 37C.

Results are in as follows:

ST-no zone

SA-no zone
LM- clear zone

EC-clear zone

I-not much growth, but not very clear zone
 Therefore, after much measurement, we have:
Average inhibition zone, in mm
Looking at I plate sets, the zone are not that clear, but the microbe growth is not that vigorous either. There are spots of microbe in the "zone" around the plates. This either due to 1) microbes in I are slow-growing (not so) or 2) it's very effective that no microbe has grown. The little growth seen are probably lucky few contaminant/resistant ones.

In conclusion, the sample is very effective on L.monocytogenes, E.coli, and not effective on S.aureus and S.typhi. More test should be done to confirm I.


Tuesday, April 10, 2012

What went wrong?

A good trait of a scientifically-trained person is to investigate a result that goes differently than expected. Now, what is to do, for example, if the result seems neither bad nor good?


The case in hand--this is an antimicrobial test using the Agar-Well method. 24-hour cultured microbes are grown in plates using pour agar method. 100 microliter of sample extract is poured into wells of 0.7mm diameter. Then, it is incubated for 18 hours. The expected result is an inhibition zone, that is a clear zone with no microbe growth around the well of the sample.

The result that came out isn't as expected--an inhibition zone is shown all right; but it is not a clear zone. Rather, it seems very opaque. As follows.


So, after much pondering, possible explanation is as follows:
1) the sample really spread outside the well, creating an inhibition zone.
2) that wasn't the sample, it was a living, growing microbe.

therefore, this hypothesis is put to the test by taking a bit from the "inhibition zone" and streaking it on a new plate:
A growth of similar shape and color occurs, which tells me this is a microbe. So the (2) reason is accepted.

Then, looking deeper, the second reason has two possible outcomes, that is:
a) the sample is contaminated from somewhere else.
b) the sample has it's own microbe that has inhibitory properties.

So, to test this, is to take a swab of the original sample straight from the bottles, for every batch.
The swab is streaked on a nutrient agar and left for 18 hours. If not all the sample shows the growth, (a) is true. But if every batch shows the same microbe, (b) is true.

The result is shown as below:


Well, only one sample plate shown to have the microbe--the 6th March sample used in the agar-well test. Therefore, it is proven that this is a one-off contamination and not a special microbe.


Another thing to add--during the agar well test though, in some other plates, the growth inhibition effect does not show. it can be explained, since probably the microbe in the sample is unable to inhibit the culture's microbes.


So in conclusion, one of the sample was contaminated with a microbe that is selectively inhibiting. May be useful, maybe not. We'll see.

I guess that is how a student's mind should work eh. Later guys :)